[:en]Grindrod has unbundled their shipping business into a separate listing, with the main listing of the shipping business on the Nasdaq in the US and the secondary listing on the JSE. On the 19th of June the company made the following announcement: “Shareholders are advised that total earnings per share for the six months ending 30 June 2018 is expected to be positive (an increase of more than 100%). The prior year comparative period, being the six months that ended 30 June 2017, reflected a loss per share of 11.5 cents. The improvement is due to the foreign currency translation reserve release as a result of the spin- off of the Shipping business.”
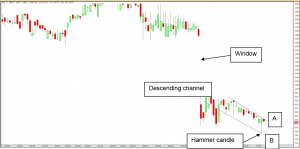
- The strong hammer candle (positive) from a low base on the share implies that the buyers bought in weakness during that session.
- The share is caught within a descending channel (positive) between line A (R8-41) and line B (R7-47). The channel will be confirmed above line A which can take the share to R9-20 below line B the formation will be wiped off the table.
- The fundamental window of the unbundling is still visible between R10-06 and R12-68. Technical analysts know that windows always close. However, it can take weeks, months or even years.
- For traders – Buy above line A (R8-41) but use line B as stop loss to protect capital. The possible targets towards the top are R8-59, R8-71, R8-80, R8-90, R9-03 and R9-20.
- For medium to long term investors – The share is heavily oversold which makes the probability of a bounce more likely however we would prefer a higher lows on the weekly graph first. But if you are keen to start to nibble yet do the same as the traders above.
Dont hesitate to ask if anything is unclear.
Frans & Christelle[:AF]Grindrod het hul verskeepsbesigheid ontbondel in 'n afsonderlike notering, met die primere notering van die skeepsbesigheid op die Nasdaq in die VSA en die sekondêre notering op die JSE. Op 19 Junie het die maatskappy die volgende aankondiging gemaak: "Die totale verdienste per aandeel vir die ses maande geëindig 30 Junie 2018 was positief gewees ('n toename van meer as 100%). Die vorige jaar se vergelykende syfers vir die ses maande wat op 30 Junie 2017 geëindig het, het 'n verlies per aandeel van 11,5 sent gereflekteer. Die verbetering is te wyte aan die buitelandse valuta reserwes van die verskepingsbesigheid na die ontbondeling".
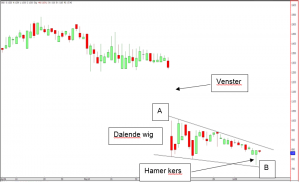
- Die hamer kers (positief) ontstaan nadat die aandeel onder verkoopdruk deurgeloop het. Die hamer impliseer dat kopers in swakte aan die aandeel gepeusel het en dat die hamer dalk laagtepunte uitkap.
- Die aandeel is vasgevang binne 'n ontwikkelende dalende wig (positief) tussen lyn A (R8-49) en lyn B (R7-47). Die kanaal sal bo lyn A bevestig word wat die aandeel kan neem na R9-20 en onder lyn B sal die formasie van die tafel wees.
- Die fundamentele venster geskep deur die ontbondeling is steeds sigbaar tussen R10-06 en R12-68. Tegniese ontleders weet dat vensters gewoonlik toemaak. Dit kan egter weke, maande of selfs jare duur.
- Vir spekulante - Koop bo lyn A (R8-49), maar gebruik lyn B as keerverlies om kapitaal te beskerm. Die moontlike teikens na bo is R8-59, R8-71, R8-80, R8-90, R9-03 en R9-20.
- Vir medium tot langtermyn beleggers - Die aandeel is oorverkoop, wat dalk een of andertyd ‘n herstel lopie kan inlui. Ons sal egter eers ‘n hoër laagtepunt op die weeklikse grafiek wil sien voordat ons begin akkumuleer. Maar as jy gretig is om te begin peusel, doen dieselfde as die spekulante hierbo.
Laat weet indien daar enige vrae is
Frans & Christelle[:]