[:en]
Many investors want exposure to foreign shares, but do not want to send physical money abroad, and want to invest in Rand terms. Then the Sygnia World Index Fund is an option. The Sygnia ITRIX MSCI World Index ETF (Exchange-traded Fund) can be purchased on any equity (equity) account.
The Sygnia ITRIX MSCI World Index ETF (exchange traded fund) can be bought on any equity (share) account. The United states constitutes 57.1% of this index, followed by Japan 9.1%, United Kingdom 6.1%, France 3.7%, Germany 3.5%, Switzerland 3.2% and others. The sector with the most exposure is the financial sector with a 18.4% exposure followed by the information technology sector with a 17.8% exposure.
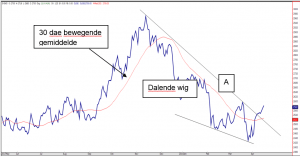
- After weeks of profit taking the 30 day moving average (R25-27) has changed into a support.
- The falling wedge (possibly positive) also caught our attention.
- The formation will be confirmed above line A (R25-43), which can take the share to R26-76 should the formation play out.
- Below R24-42 the optimism around the formation will be wiped off the table.
- For traders – Buy above line A but use R24-24 as stop loss to protect capital. The possible targets towards the top are R24-72, R25-07, R25-54, R26-12 and R26-76.
- For medium to long term investors – Nibble above line A but use the same stop loss as given to traders above.
Don't hesitate to ask if anything is unclear.
Frans de Klerk[:AF]
Talle beleggers wil graag blootstelling aan buitelandse aandele hê, maar wil nie graag fisiese geld na die buiteland toe stuur nie, en wil die belegging in Rand doen. Dan is die Sygnia World Index fonds ‘n opsie. Die Sygnia ITRIX MSCI World Index ETF (beursverhandelde fonds) kan op enige ekwiteits (aandele) rekening gekoop word.
Die samestelling van die fonds op die oomblik is dat die Verenigde State 57,1% verteenwoordig van hierdie indeks, gevolg deur Japan 9,1%, Brittanje 6,1%, Frankryk 3,7%, Duitsland 3,5%, Switserland 3,2% en ander. Die sektor wat die meeste blootstelling geniet is die finansiële sektor met 'n blootstelling van 18,4%, gevolg deur die inligtingstegnologie-sektor met 'n blootstelling van 17,8%.
- Na weke se dalings verander die 30 dae bewegende gemiddelde (R25-27) weer in ‘n steun.
- Die dalende wig (moontlik positief) vang ook die oog.
- Bo lyn A (R25-43), kan die dalende wig momentum na bo opbou en die aandeel na R26-76 neem indien die formasie na bo sy teiken bereik.
- Onder R24-42 sal die positiwiteit van die formasie van die tafel gevee word.
- Vir spekulante - Koop bo lyn A, maar gebruik R24-24 as keerverlies om kapitaal te beskerm. Die moontlike teikens na bo is R24-72, R25-07, R25-54, R26-12 en R26-76.
- Vir medium- tot langtermynbeleggers – peusel ook bo lyn A, en hou by dieselfde keerverlies as deurgegee aan spekulante.
Laat weet gerus indien daar enige vrae is.
Frans de Klerk[:]